Bun Performance Monitoring
What is OpenTelemetry?
Bun uses OpenTelemetry to monitor database performance and errors through OpenTelemetry tracing and OpenTelemetry metrics.
OpenTelemetry is designed to be language- and framework-agnostic, supporting multiple programming languages and frameworks. It provides language-specific software development kits (SDKs) that simplify the integration of telemetry collection into applications written in different languages.
OpenTelemetry also provides exporters and integrations to send telemetry data to various OpenTelemetry backend systems and observability platforms, including popular tools like Prometheus, Grafana, Jaeger, Zipkin, and Elasticsearch.
By using OpenTelemetry, developers can adopt a standardized approach to observability, making it easier to collect and analyze telemetry data across different components of a distributed system. This helps improve troubleshooting, performance optimization, and application monitoring by providing valuable insights into application behavior and performance.
OpenTelemetry Instrumentation
Bun includes OpenTelemetry instrumentation called bunotel, which is distributed as a separate module:
go get github.com/uptrace/bun/extra/bunotel
To instrument a Bun database, you need to add the hook provided by bunotel:
import "github.com/uptrace/bun/extra/bunotel"

db := bun.NewDB(sqldb, dialect)
db.AddQueryHook(bunotel.NewQueryHook(bunotel.WithDBName("mydb")))
To enable tracing, you must use an active span context when executing queries:
ctx := req.Context()
err := db.NewSelect().Scan(ctx)
Uptrace
Uptrace is an open-source APM for OpenTelemetry that supports distributed tracing, metrics, and logs. You can use it to monitor applications and troubleshoot issues.
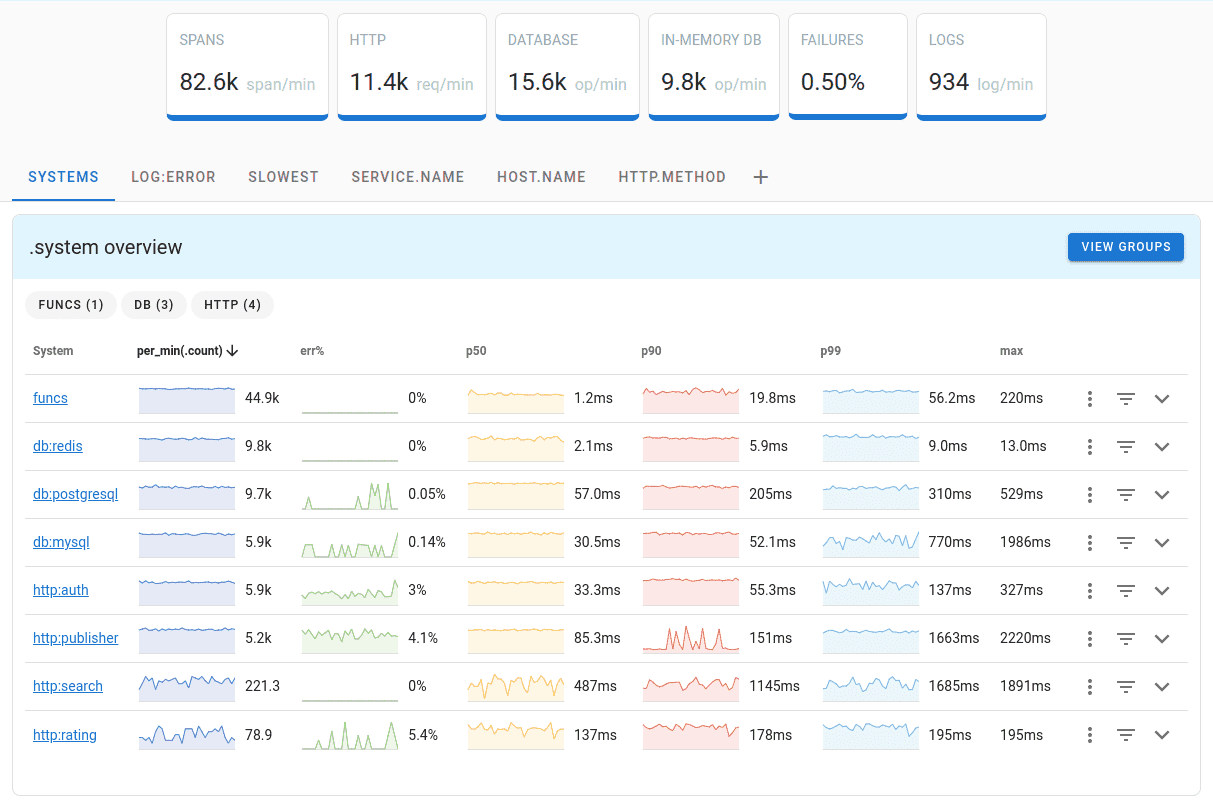
Uptrace includes an intuitive query builder, rich dashboards, alerting rules, notifications, and integrations for most languages and frameworks.
Uptrace can process billions of spans and metrics on a single server, allowing you to monitor your applications at 10x lower cost.
You can try Uptrace in just a few minutes by visiting the cloud demo (no login required) or running it locally with Docker. The source code is available on GitHub.
Prometheus
OpenTelemetry integrates with Prometheus, a popular monitoring and alerting system, to collect and export telemetry data.
By integrating OpenTelemetry with Prometheus, you can leverage Prometheus's powerful monitoring and alerting capabilities while benefiting from the flexibility and standardization provided by OpenTelemetry. This integration enables you to collect, store, visualize, and analyze metrics from your applications and systems, gaining valuable insights into their performance and behavior.
You can send OpenTelemetry metrics to Prometheus using the OpenTelemetry Prometheus exporter.
Conclusion
Monitoring SQL performance is crucial for optimizing query execution, improving application responsiveness, ensuring scalability, troubleshooting issues, and maintaining database security and compliance. It enables you to proactively manage and optimize your SQL infrastructure, leading to better application performance, efficient resource utilization, and enhanced user satisfaction.
Related Resources: