Tuning PostgreSQL settings for performance
PostgreSQL has many configuration options that can be adjusted to improve performance. Here are some tips for tuning PostgreSQL performance.

max_connections
Use a reasonably low number of connections so you can give each connection more RAM, disk time, and CPU. To not get FATAL too many connections error, use a connection pool in front of PostgreSQL, for example, PgBouncer is a good option.
max_connections = <4-8 * number_of_cpus>
On SSD, set max_connections to the number of concurrent I/O requests the disk(s) can handle * number_of_cpus.
shared_buffers
shared_buffers controls how much memory PostgreSQL reserves for writing data to a disk. PostgreSQL picks a free page of RAM in shared buffers, writes the data into it, marks the page as dirty, and lets another process asynchronously write dirty pages to the disk in background.
PostgreSQL also uses shared buffers as a cache if the data you are reading can be found there. For proper explanation, see this.
WARNING
Lowering shared buffers value too much may hurt write performance.
shared_buffers = <20-40% of RAM>
work_mem
work_mem specifies the max amount of memory each PostgreSQL query can use before falling back to temporary disk files. Every query may request the value defined by work_mem multiple times so be cautious with large values.
work_mem = <1-5% of RAM>
If your queries often use temp files, consider increasing work_mem value and lowering the max number of concurrent queries via max_connections.
The optimal value for work_mem can vary depending on your specific workload, hardware resources, and available memory. Regular monitoring, benchmarking, and tuning are necessary to ensure optimal performance as your workload evolves over time.
maintenance_work_mem
maintenance_work_mem limits the max amount of memory that can be used by maintenance operations, for example, CREATE INDEX or ALTER TABLE.
maintenance_work_mem = <10-20% of RAM>
effective_cache_size
effective_cache_size gives PostgreSQL a hint about how much data it can expect to find in the system cache or ZFS ARC.
effective_cache_size = <70-80% of RAM>
Autovacuum
Autovacuum is a background process responsible for removing dead tuples (deleted rows) and updating database statistics used by PostgreSQL query planner to optimize queries.
Default autovacuum settings are rather conservative and can be increased to let autovacuum run more often and use more resources:
# Allow vacuum to do more work before sleeping.
# 500-1000 should be enough.
vacuum_cost_limit = 500

# Use smaller nap time if you have many tables.
autovacuum_naptime = 10s

# Ran autovacuum when 5% of rows are inserted/updated/deleted.
autovacuum_vacuum_scale_factor = 0.05
autovacuum_vacuum_insert_scale_factor = 0.05
You can also run less autovacuum workers but give each of them more memory:
# Run 2 autovacuum workers instead of 3.
autovacuum_max_workers = 2

# But give them more memory.
autovacuum_work_mem = <2-3% of RAM>
WAL
PostgreSQL WAL stands for Write-Ahead Logging. The Write-Ahead Log is a transaction log that records changes made to the database before they are written to the actual data files.
When a transaction modifies the data in PostgreSQL, the changes are first written to the WAL before being applied to the actual database files. This process ensures that the changes are durably recorded on disk before considering the transaction committed.
The following WAL settings work well most of the time and the only downside is increased recovery time when your database crashes:
wal_compression = on
min_wal_size = 1GB
max_wal_size = 8GB
wal_buffers = 16MB
checkpoint_timeout = 30min
checkpoint_completion_target = 0.9
SSD
If you are using solid-state drives, consider tweaking the following settings:
# Cost of a randomaly fetched disk page.
# SSDs have low random reads cost relative to sequential reads.
random_page_cost = 1.1

# Number of simultaneous requests that can be handled efficiently by the disk subsystem.
# SSDs can handle more concurrent requests.
effective_io_concurrency = 200
Timeouts
You can tell PostgreSQL to cancel slow queries using the following settings:
# Cancel queries slower than 5 seconds.
statement_timeout = 5000

# Max time to wait for a lock.
lock_timeout = 5000
Logging
Good logging can tell you when queries are too slow or there are any other problems:
# Log queries slower than 500ms.
log_min_duration_statement = 500

# Log queries that use temp files.
log_temp_files = 0

# Log queries that wait for locks.
log_lock_waits = on
Huge pages
Huge pages, also known as large pages, are a memory management feature in operating systems that allow applications to allocate and utilize larger page sizes than the standard small pages. In the context of databases like PostgreSQL, huge pages can offer performance benefits by reducing memory overhead and improving memory access efficiency.
If your servers have 128+ GB of RAM, consider using huge pages to reduce the number of memory pages and to minimize the overhead introduced by managing large amount of pages.
Use indexes
Indexes can significantly speed up query performance by allowing PostgreSQL to quickly locate the data it needs. Ensure that your tables have appropriate indexes based on the queries being run.
Use the EXPLAIN command to analyze queries and identify areas for optimization.
EXPLAIN ANALYZE SELECT ...;
Partitioning
If your tables are very large, consider partitioning them. Partitioning can improve query performance by allowing PostgreSQL to quickly access the relevant data.
See PostgreSQL Table Partitioning.
Cursor pagination
When dealing with large data sets, such as in a web application that needs to display a large number of records. consider using cursor pagination.
Monitoring performance
Regularly monitoring database activity can help identify performance issues. Use tables such as pg_stat_activity, pg_stat_database, and pg_stat_user_tables to monitor database activity and identify areas for optimization.
To monitor PostgreSQL, you can use OpenTelemetry PostgreSQL receiver that comes with OpenTelemetry Collector.
Uptrace is a OpenTelemetry APM that supports distributed tracing, metrics, and logs. You can use it to monitor applications and troubleshoot issues.
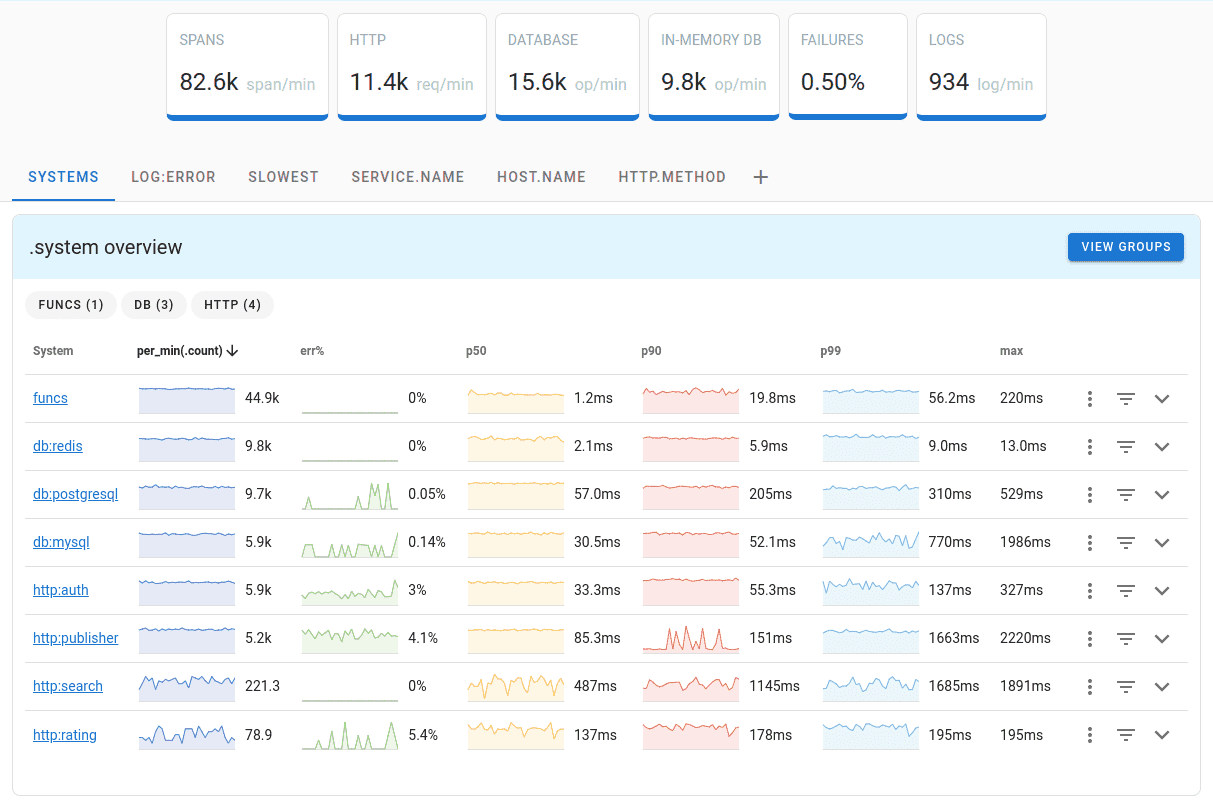
Uptrace comes with an intuitive query builder, rich dashboards, alerting rules with notifications, and integrations for most languages and frameworks.
Uptrace can process billions of spans and metrics on a single server and allows you to monitor your applications at 10x lower cost.
In just a few minutes, you can try Uptrace by visiting the cloud demo (no login required) or running it locally with Docker. The source code is available on GitHub.